If you are using the Profile 2 module
to set up multiple profiles in a Drupal website, and you want each
visitor to register any new account using only one of those profiles,
then you should redirect the Drupal path "user/register" — using a URL
alias or an HTTP redirect — to a new page that explains the different
profiles and has links to the unique registration pages for each one.
(For any profile P, the Drupal path to the profile-specific registration
page would be "/P/register".) Otherwise, a visitor may arrive at the
generic registration page (intentionally or otherwise) and create a new
account independent of those profiles.
At "Drupal Experts" we have tried to cover wide range of experience and solutions from various professionals and try to keep good knowledge of online environment. We have taken information from various websites and professionals so it can be concluded into one platform. We are updating our blog so please be patient.
Wednesday, February 17, 2016
Drush on Mac OS X Troubles? Could be a Case Issue...
I recently discovered the solution to a long-standing drush issue I have been experiencing on Mac OS X. The symptoms of the problem included several mysterious fatal errors that would crop up from time-to-time as well as the fact that I've had to use the
I finally tracked down the issue to case-sensitivity. On my Mac, I keep all my local sites in the
Up until yesterday, whenever I would fire up my Terminal app, I would (by default) be deposited in
The solution is dead simple. When I fire up my Terminal app, I now use
--uri=mysite.dev parameter for every local site on my computer.I finally tracked down the issue to case-sensitivity. On my Mac, I keep all my local sites in the
/Users/michael/Sites
directory - this is the default directory that comes with OS X, and can
be used by the Mac's built-in version of Apache. I use both MAMP Pro
(for client sites) and Acquia Dev Desktop (for teaching), and every site
I have lives in this directory.Up until yesterday, whenever I would fire up my Terminal app, I would (by default) be deposited in
/Users/michael, so my first order of business would be to do a cd sites/[directory of the site I wanted to work with].
While that worked fine as far as my Mac was concerned, when I then went
to run a drush command, I would either get a fatal error (cannot
redeclare a function) or drush wouldn't know which site it was in, and
I'd be forced to either use a drush alias or the --uri=mysite.dev
parameter. It turns out that because drush is (and most *nix-y tools
are) case sensitive, it wasn't actually finding my site, hence the need
for the --uri=mysite.dev parameter.The solution is dead simple. When I fire up my Terminal app, I now use
cd Sites, with a capital "S" (actually, I just set a new default directory for it). So far (less than 24 hours in), this has solved every single drush issue I had been having.Re-ordering Views Attachment Displays
If
you have a Drupal 7 view with more than one attachment display, it is
not super-obvious how you can reorder the displays. When you create a
new attachment display, you can choose the display to attach the
attachment display to as well as the position ("before", "after", or
"both").
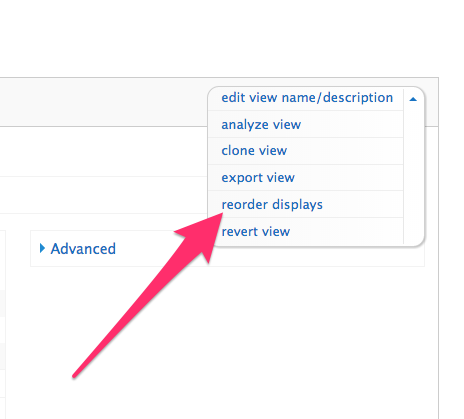
But what if you need to attach two attachment displays "before" another display - how can you control the order of the two attachment displays.
it's actually quite easy once you know how - in the view's "edit view name/description", there is a "reorder displays" option. Click it and behold!
But what if you need to attach two attachment displays "before" another display - how can you control the order of the two attachment displays.
it's actually quite easy once you know how - in the view's "edit view name/description", there is a "reorder displays" option. Click it and behold!
Debugging with PhpStorm (Including Drush)
I recently made the switch from another (several) code editors to PhpStorm
based on the recommendations of several members of the Drupal community
- not to mention all the postive things I've heard about it on IRC and
various other places.
My main motivation for making the switch was the ability to have a integrated debugger - both when running Drupal in a web browser and via Drush. While there are plenty of resources online demonstrating how to set up the debugger, I found that I needed to do a combination of things to make it happen
To make it work from the command line (Drush), I also had to add this stuff to another php.ini file. I figured out which one by doing a
If you're using another command line interface, you'll need to make a similar addition. Be sure to
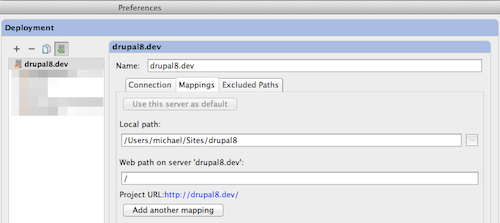
The deployment server mappings were left at their default values:
and happily debug away. If it doesn't work, here are a couple of things you can take a look at:
My main motivation for making the switch was the ability to have a integrated debugger - both when running Drupal in a web browser and via Drush. While there are plenty of resources online demonstrating how to set up the debugger, I found that I needed to do a combination of things to make it happen
Enable xDebug
Depending on your *AMP stack, xDebug may or may not be enabled by default. I use MAMP Pro, and it wasn't. It was easy enough to enable - I added the following to my php.ini file (note that the path will be dependent on the version of PHP you'd like to use):[xdebug]
zend_extension="/Applications/MAMP/bin/php/php5.4.4/lib/php/extensions/no-debug-non-zts-20100525/xdebug.so"
xdebug.profiler_enable = 0
xdebug.profiler_output_dir = "/tmp"
xdebug.remote_enable=1
xdebug.remote_host=localhost
xdebug.remote_port=9000
xdebug.remote_handler=dbgp
xdebug.max_nesting_level=500
xdebug.idekey=PHPSTORMTo make it work from the command line (Drush), I also had to add this stuff to another php.ini file. I figured out which one by doing a
drush status and seeing which PHP configuration it was using. Here's some documentation demonstrating how to confirm you're good-to-go.Update .bash_profile
If you want to be able to debug Drush commands, you'll need to add the following to your .bash_profile:export XDEBUG_CONFIG="idekey=PHPSTORM"If you're using another command line interface, you'll need to make a similar addition. Be sure to
source ~/.bash_profile after you make the change (or restart your terminal session). See Angus Max's post on Lullabot.com for more details.Configure PhpStorm
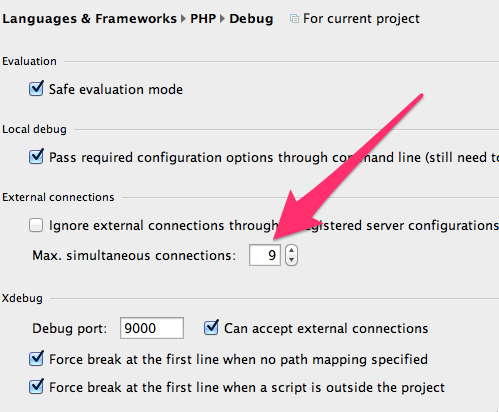
JetBrains (the makers behind PhpStorm) provide decent online documentation - I found this post and this screencast especially helpful. For my situation, where I wanted to debug a local site, the following settings are key:Max. Simultaneous Connections
When debugging automated tests using the run-tests.sh script, it is crucial that PhpStorm's "Max Simultaneous Connections" for PHP Debugging is set to a sufficiently large value. "9" works for me.Setting up a deployment server
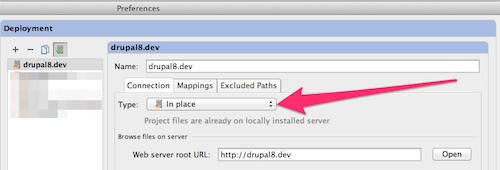
Configuring a deployment server is one of the key things you need to do in order to debug in PhpStorm. While PhpStorm supports remote debugging, for my situation, the "In place" deployment type was sufficient.The deployment server mappings were left at their default values:
Troubleshooting
At this point, you should be able to enable the PhpStorm debugging listener, go into your browser, turn debugging on (either via a browser extension or bookmarkletand happily debug away. If it doesn't work, here are a couple of things you can take a look at:
- Case-senstitivity in paths - on my machine, the path to my "Sites" directory is "/Users/michael/Sites". I had an issue where breakpoints weren't working that I tracked down to a lower case "s" in "Sites" that I mistakenly set up in my Apahce virtual host for the site ("/Users/michael/sites" instead of "/Users/michael/Sites").
- xdebug version - some versions of xdebug are better than others. Several months ago I had an issue with xdebug not working properly when debugging from the commandline (Drush). I tracked it down to an old, buggy version of xdebug. I updated xdebug and all was well.
- Some people use PhpStorm "configurations" to configure debugging, while this works fine, it isn't necessary. I have zero "configurations" configured on my machine.
- Debugging from Drush - be sure to set your PHP_ID_CONFIG value to same value as your PhpStorm project "server".
- Do you use Acquia Dev Desktop?
Subscribe to:
Posts (Atom)